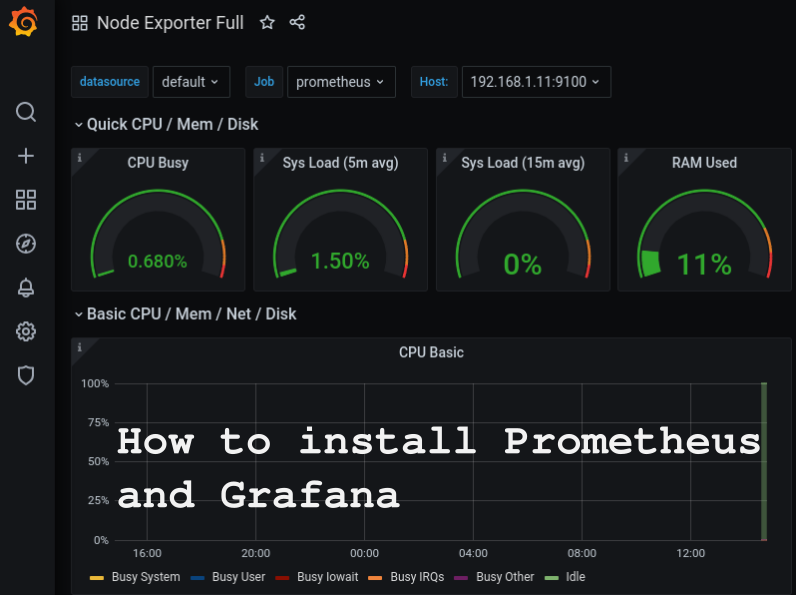
If you don’t monitor you can’t know the problem or measure metrics, in this post we’ll install prometheus to monitor a server and grafana to create a dashboard.
Infra required
create 3 servers:
monitor-server, this server will be used as premetheus.
monitor-target, this server will be Linux machine we will monitor.
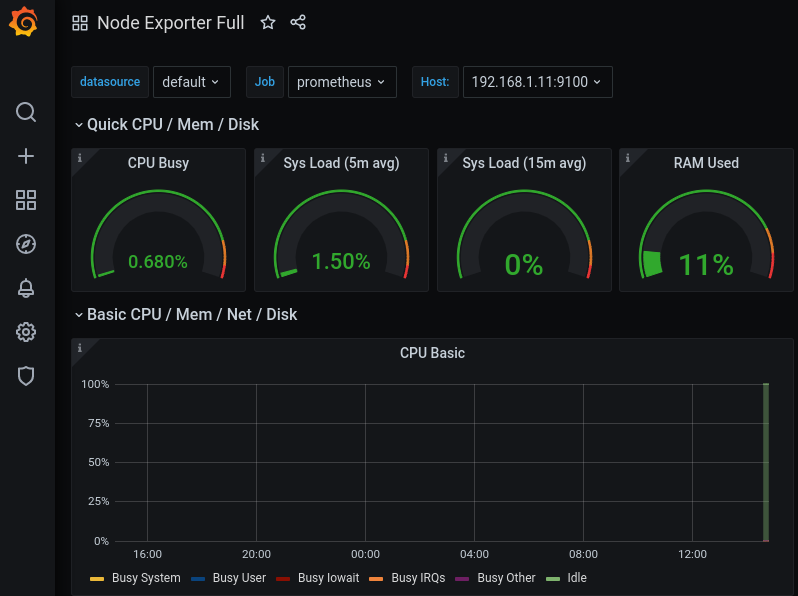
monitor-dashboard, this server is grafana.
Install Prometheus
wget https://github.com/prometheus/prometheus/releases/download/v2.25.0/prometheus-2.25.0.linux-amd64.tar.gzExtract files
tar xvfz prometheus-*.tar.gz
cd prometheus-*
Start the prometheus server to verify installation
./prometheus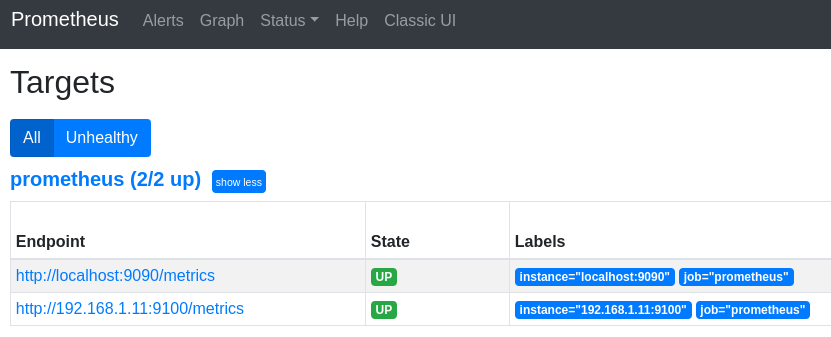
Install Node Explorer
get https://github.com/prometheus/node_exporter/releases/download/v1.1.1/node_exporter-1.1.1.linux-amd64.tar.gzExtract files
tar xvfz node_exporter-*.*-amd64.tar.gz
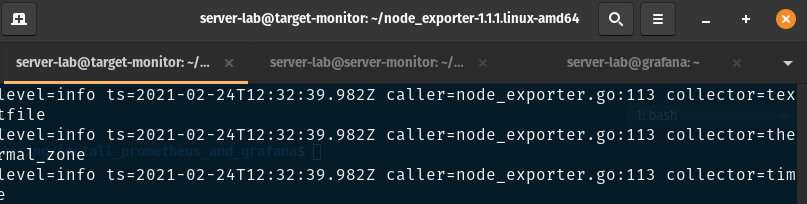
cd node_exporter-*.*-amd64Run Node Exporter to start collecting metrics
./node_exporterInstall Grafana
apt-get install -y adduser libfontconfig1wget https://dl.grafana.com/oss/release/grafana_7.4.2_amd64.deb
apt install ./grafana_7.4.2_amd64.deb
Configuration file location
/etc/grafana/grafana.iniStart Grafana server
systemctl start grafana-server
systemctl status grafana-server
If you want the full detailed instructions its at this LINK
(Visited 175 times, 1 visits today)