Posts in Linux

Compute Group Vs. Cluster

Do you have a cluster or compute group for your production?

What is a compute group?

What is a cluster?

Compute Group

Compute Group is a set of identical servers doing the same function.

Example of a compute group: Apache (web servers)
Your website traffic is increasing and you need to add more servers to handle the load, so you add another web server (let’s say it’s Apache) and than another.

Those web servers are doing the same thing (function) which is presenting web files (HTML) to visitors on the website, now those web servers are not connected together and don’t “know” about other web servers.

So, how does this scenario work?

The Load-Balancer is forwarding traffic to the web servers (let’s say it’s round-robin) and those web servers are presenting files to the visitors.

You can add or remove web servers per demand.

Cluster

Cluster is a group of compute servers that are connected and can operate together and “know” about each member of the cluster.

Example of a cluster: Kafka

Kafka has a minimum of 3 nodes in a cluster and those 3 nodes are configured with the IP of the other members of the cluster and elect a leader out of the 3 nodes.

If there’s an issue with one of the nodes the other can take it’s responsibility, thus you achieve high-availability.

10 tools for cloud admins

As a cloud admin your work is broad and you need tools to improve your work and efficiency.

Here’s the best 10 tools in my opinion every cloud admin should have in their tool belt, or their laptop in our case.

This is my list and the best tools in my opinion.

Code

1. VS Code is one of the popular code editors and it is my preferred code editor, it has many plugins and you can customize it to your preferences

2. Python is the easiest and most robust coding tool for cloud admins, with plugin support to almost any cloud.
no need for introduction here

3. boto3 is specific for AWS but still worth mentioning if you’re using AWS as your cloud.
it have a very good documentation and does the job, it’s very important when you integrate automation with your projects.

Servers

4. Docker is by far the fastest way to install something, it’s just docker run image-name and the app is installed, although it’s not recommended for production it is suitable for IT servers, just remember to backup the volumes.

5. OpenVpn is a great tool to encrypt the connection to your servers, it can also save some public IP addresses since you connect to the server’s private IP addresses.

6. Sensu is great to know what’s up with your servers, get the metric you want to know and get alerts for something you need to know

7. Puppet is your preferred option if you don’t use Docker in your servers, it can configure your servers and maintain a state for your servers, easy to use and plenty of modules to choose from.

Misc

8. Zsh is better then the default terminal consoles and is can be used in your laptop and in your servers, install it on your servers as well to get the experience you get on your laptop.

9. Let’s Encrypt made it so easy to secure your public connections to your apps, there’s is really no reason why not to use it for your apps.

10. KeePass is a password manager that you need because you connect to many servers and services and it’s a great tool for this task, just remember to backup KeePass database.

How to install Prometheus and Grafana

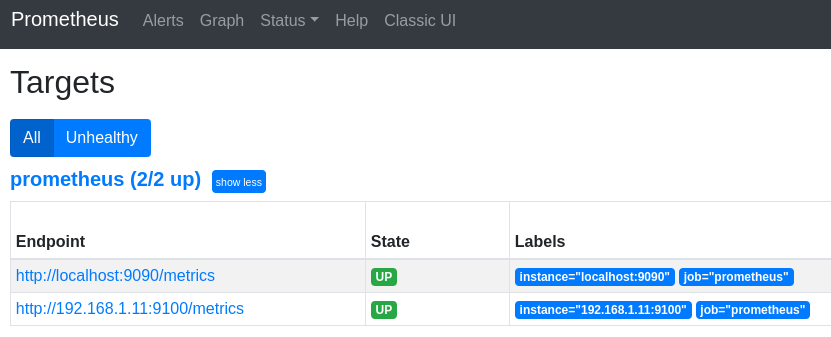
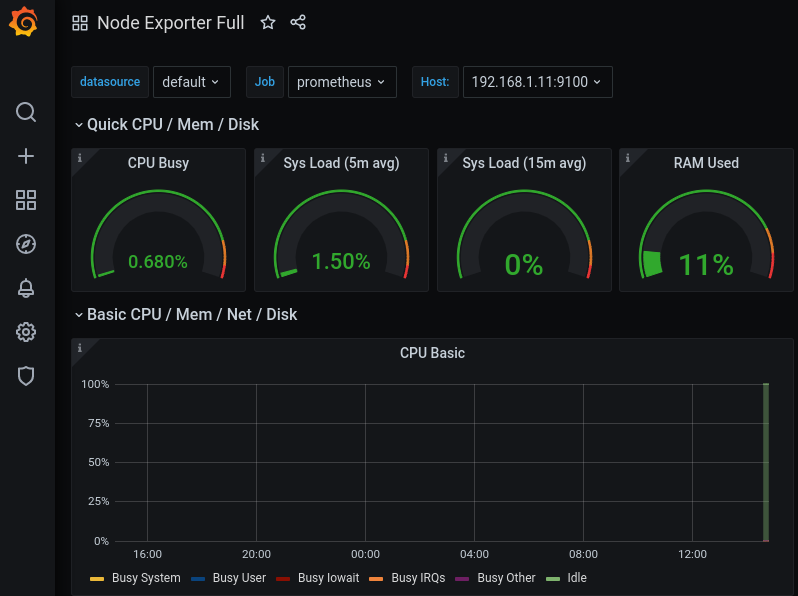
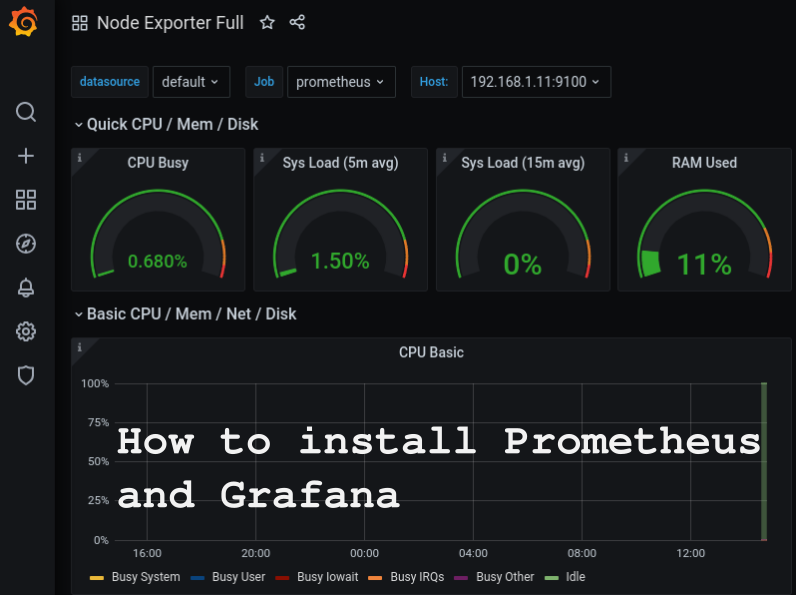
If you don’t monitor you can’t know the problem or measure metrics, in this post we’ll install prometheus to monitor a server and grafana to create a dashboard.

Infra required

create 3 servers:
monitor-server, this server will be used as premetheus.
monitor-target, this server will be Linux machine we will monitor.
monitor-dashboard, this server is grafana.

Install Prometheus

wget https://github.com/prometheus/prometheus/releases/download/v2.25.0/prometheus-2.25.0.linux-amd64.tar.gz

Extract files

tar xvfz prometheus-*.tar.gz
cd prometheus-*

Start the prometheus server to verify installation

./prometheus

Install Node Explorer

get https://github.com/prometheus/node_exporter/releases/download/v1.1.1/node_exporter-1.1.1.linux-amd64.tar.gz

Extract files

tar xvfz node_exporter-*.*-amd64.tar.gz
cd node_exporter-*.*-amd64

Run Node Exporter to start collecting metrics

 ./node_exporter

Install Grafana

apt-get install -y adduser libfontconfig1wget https://dl.grafana.com/oss/release/grafana_7.4.2_amd64.deb
apt install ./grafana_7.4.2_amd64.deb

Configuration file location

 /etc/grafana/grafana.ini

Start Grafana server

systemctl start grafana-server
systemctl status grafana-server

If you want the full detailed instructions its at this LINK

How to browse websites using Linux cli terminal

Sometimes you miss the days of just a shell and a terminal cli to avoid the noise and get the info you need without distractions, in my opinion people don’t even think of that and go straight to their favorite browser. next time try something else, something like browsing from Linux terminal using cli.

How to browse websites using cli?

this blog post is for Linux users, if you’re interested in other operating systems send me an email requesting a blog post with your favorite OS and I’ll try to make one for you.

start by installing w3m

sudo apt install w3m

then browse the website

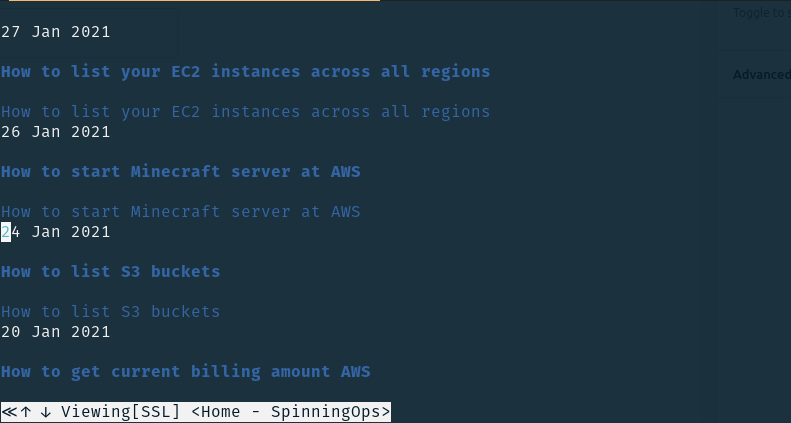
w3m spinningops.com

let’s try another website

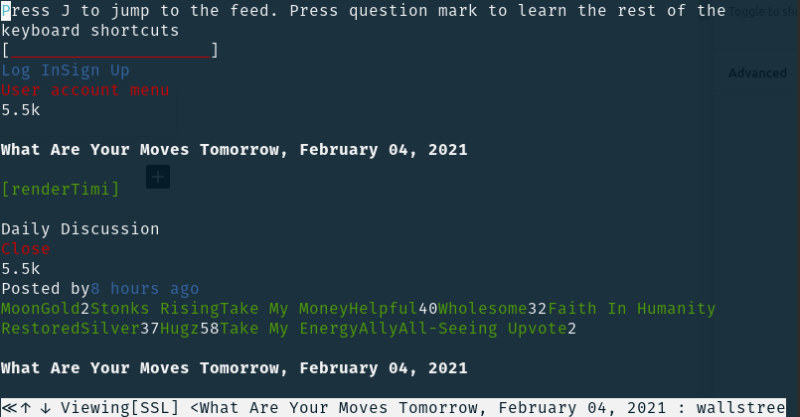
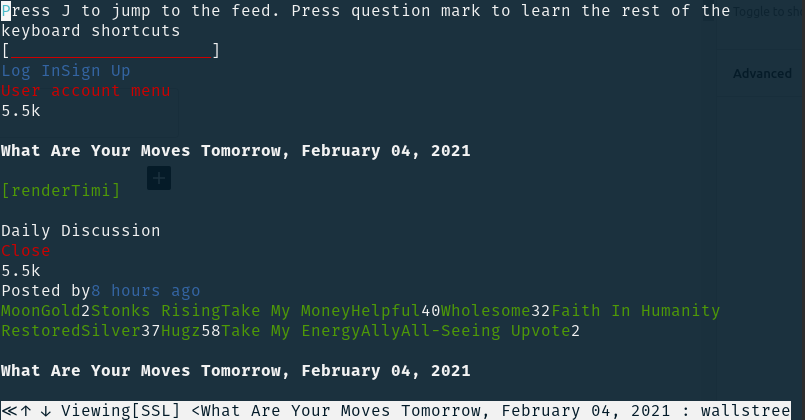
w3m www.reddit.com/r/wallstreetbets

use keyboard arrows to navigate throw the website, use Enter key to click a link and use Q key to exit the cli browser