Posts in Monitoring

How to install Sensu

Monitor your servers is highly important to ensure that the service you offer is accessible to customers, so you need a monitoring tool, but which one you choose? in this blog post, we’ll talk about Sensu.

What is Sensu?

Sensu is a monitoring tool and observability pipeline that enable Monitoring-as-Code

What does Monitoring-as-Code mean?

With Monitoring-as-Code you can manage your monitoring the same way you manage your code, for example, keep versions of monitoring configuration pipelines and commit them to a code repository, etc.

What does observability mean in this context?

Sensu handles the discovery of new compute instances and containers like Docker and starts monitoring them.

How to install Sensu?

Let’s install Sensu using Docker

sudo docker network create sensu
sudo docker volume create sensu-backend-data

Start the Sensu backend

sudo docker run -v sensu-backend-data:/var/lib/sensu \
-d --name sensu-backend \
--rm --network sensu -p 3000:3000 -p 8080:8080 -p 8081:8081 \
-e SENSU_BACKEND_CLUSTER_ADMIN_USERNAME=admin \
-e SENSU_BACKEND_CLUSTER_ADMIN_PASSWORD=admin \
sensu/sensu:latest \
sensu-backend start --state-dir /var/lib/sensu/sensu-backend --log-level debug

How to install Sensu Agent?

Again let’s use Docker

sudo docker run -d --rm --network sensu -p :3030 \
  sensu/sensu sensu-agent start \
  --backend-url ws://sensu-backend:8081 --deregister \
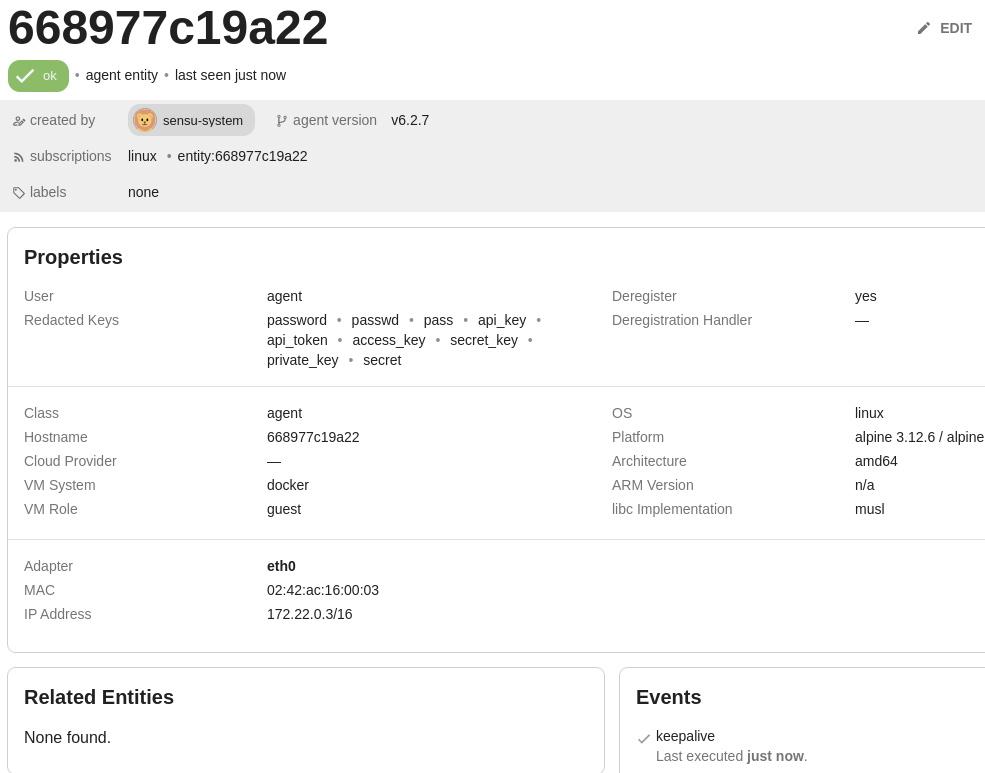
  --keepalive-interval=5 --keepalive-warning-timeout=10 --subscriptions linux

After the install of the Sensu agent, the agent registers itself to the Sensu platform and subscribes to the configured topic, and starts collecting metrics.

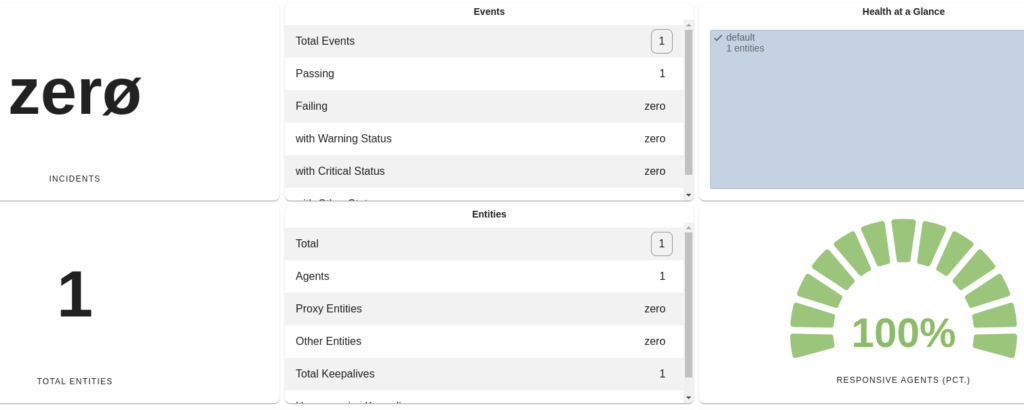
In this case the metric is keepalive

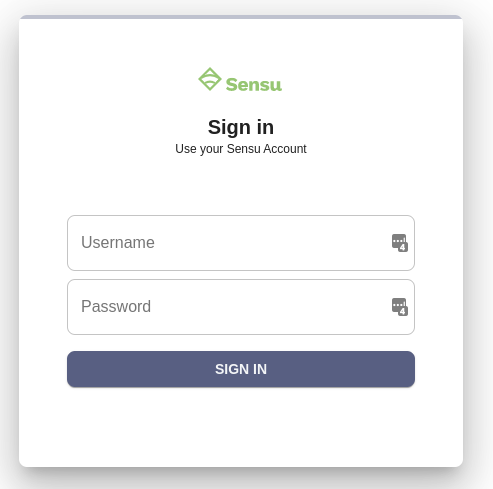
How to log in to the Sensu dashboard?

Browse to http://127.0.0.1:3000/dashboard

Sensu Subscriptions

  • Sensu backends “publish” service-based monitoring topics
  • Sensu agents “subscribe” to service-based monitoring topics
  • All monitoring configurations are managed via the control plane (Sensu backend REST API)
  • Sensu agents can be deployed at scale with minimal configuration

For more information go to Sensu website and Sensu Docs

How to install Prometheus and Grafana

If you don’t monitor you can’t know the problem or measure metrics, in this post we’ll install prometheus to monitor a server and grafana to create a dashboard.

Infra required

create 3 servers:
monitor-server, this server will be used as premetheus.
monitor-target, this server will be Linux machine we will monitor.
monitor-dashboard, this server is grafana.

Install Prometheus

wget https://github.com/prometheus/prometheus/releases/download/v2.25.0/prometheus-2.25.0.linux-amd64.tar.gz

Extract files

tar xvfz prometheus-*.tar.gz
cd prometheus-*

Start the prometheus server to verify installation

./prometheus

Install Node Explorer

get https://github.com/prometheus/node_exporter/releases/download/v1.1.1/node_exporter-1.1.1.linux-amd64.tar.gz

Extract files

tar xvfz node_exporter-*.*-amd64.tar.gz
cd node_exporter-*.*-amd64

Run Node Exporter to start collecting metrics

 ./node_exporter

Install Grafana

apt-get install -y adduser libfontconfig1wget https://dl.grafana.com/oss/release/grafana_7.4.2_amd64.deb
apt install ./grafana_7.4.2_amd64.deb

Configuration file location

 /etc/grafana/grafana.ini

Start Grafana server

systemctl start grafana-server
systemctl status grafana-server

If you want the full detailed instructions its at this LINK

How to monitor your website with only 2 metrics?

When you have a static website on your company or just for yourself you still need to monitor it to ensure it’s operational. so let’s do this with only 2 metrics.

First metric is HTTPS

by monitoring HTTPS we know that the SSL certificate is ok and the web server is responding, that’s two metrics for the price of one.

Second metric is Web-scraping

when we web scraping our website we know if the content is served as it should be thus making sure our web server responded with content pages and not empty pages.

Worth mentioning third metric

you’ll probably want to add page speed metric to make sure the website is responding fast enough for visitors.

Summary

I like to keep things simple and by using only those 2 metrics I can make sure the website is working as expected and I don’t need to monitor more than 2 or 3 metrics, I just monitor the metrics that important the most.